3 Ways Demand Forecasting Software CAN HELP FORECASTING IN 'BLACK SWAN' PERIODS
Demand Forecasting through a Pandemic
The coronavirus pandemic poses the biggest challenge to the world within most of our lifetimes. Focussing on demand forecasting at a time like this seems unimportant. BUT we need to get it as right as possible to avoid shortages which are damaging for our businesses and, more importantly, to help our customers stay safe and comfortable.
Uncertainty
No one knows, at this point, whether the forecast economic downturn will be U-shaped, V-shaped or any-shaped. Nor its duration. Indeed, some industries may benefit, at least in the short term, due to panic-buying, more time for in-home hobbies and pastimes or medical necessity.
Conventionally, demand variation ripples backwards from the end customer:
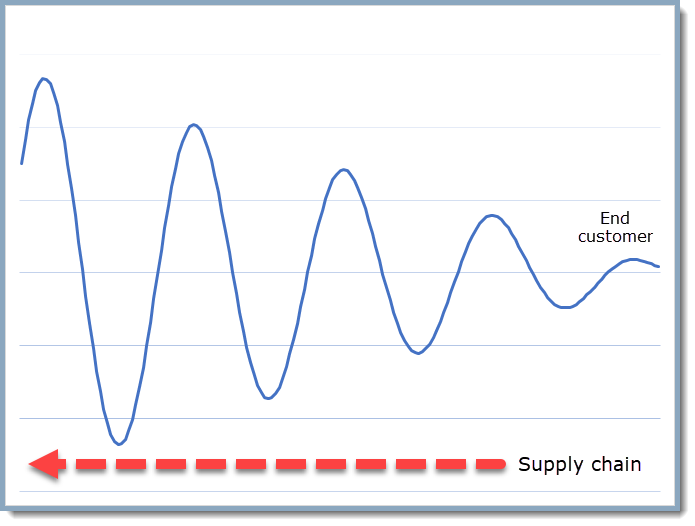
In other words, customer consumption tends to be relatively smooth, but the logistics of the supply chain mean the ripples get bigger going backwards through the supply chain, due to promotions, minimum order quantities, packaging volume discounts, inventory fill etc.. Panic-buying has distorted this pattern due to the increased amplitude of end-user demand. Forecasting uncertainty has increased as a result.
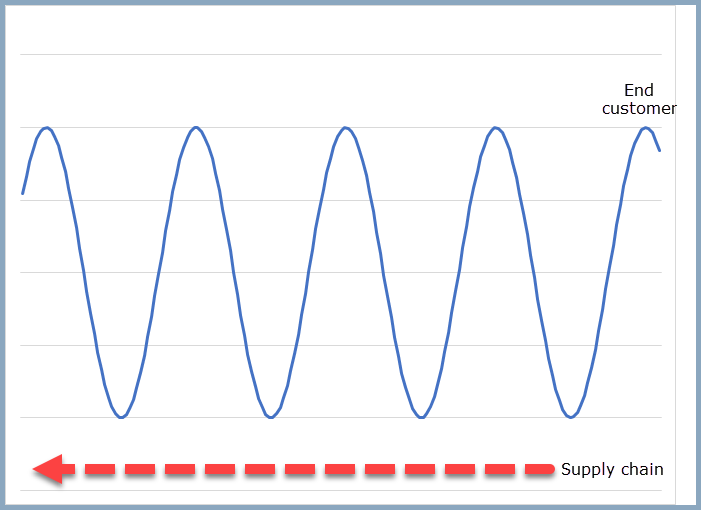
It is likely there will be no single observed demand pattern during the pandemic. Therefore there will be a variety of different demand patterns as we come out. It is unlikely that the pandemic will not simply disappear and neither will its effect on demand. Lockdowns will be lifted and re-started in phases in order to manage the allocation of scarce healthcare resources, but over as yet unknown timescales. So we currently have limited information on both the duration and amplitude of Covid-19’s run-out. As demand forecasters, we just have to work with that and adjust the forecasts as new information manifests itself.
Forecasting during the pandemic
The key to demand forecasting during this time has to be the ability to quickly detect and respond to new data and new information. No one can forecast accurately when so much is unknown about the future pattern of the virus. But we can all respond to information as it becomes available – it’s optimizing how we respond, and how quickly we respond, that matters.
Here are three key elements we think your demand forecasting software should offer, in order to help you forecast through the crisis more effectively.
1. Top-down forecasting
The 2020 forecast we started the year with is almost certainly wrong by now. However, with some adjustments for cancelled promotions and other activity, the mathematical relation between skus, or skus within customers, is still likely to be right, at least at some aggregate level. We don’t want to lose all the forecasting effort we invested in getting those relations right.
Therefore, the application of top-down or multi-level forecast adjustments (i.e. from the middle to both up and down) will allow us to retain the relationships at the detail levels, by dialling down or up the forecasts at the more aggregated levels by a judgemental percentage or amount.
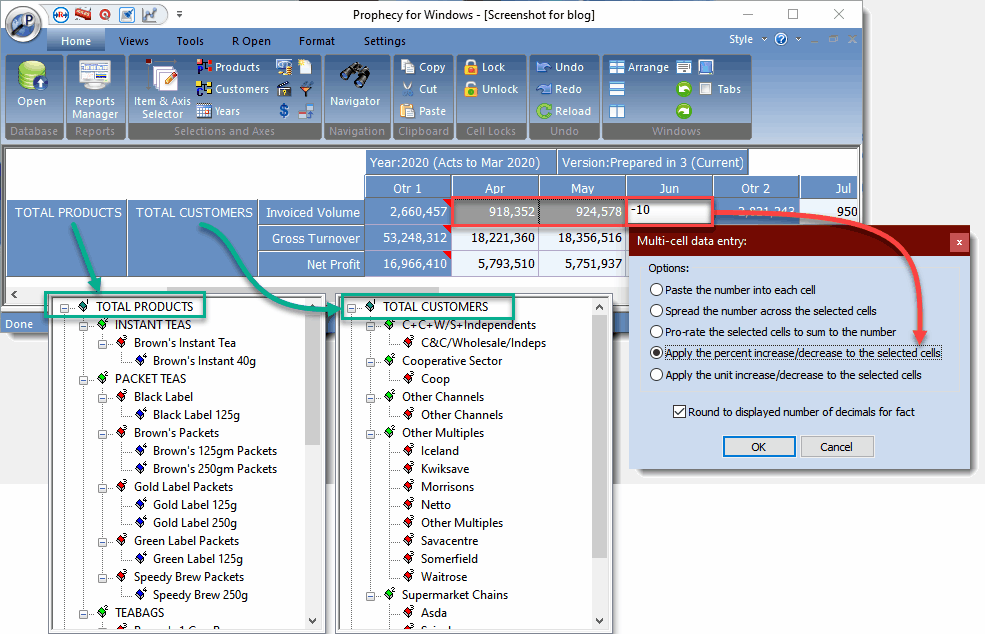
Unfortunately, no forecasting system can tell you the extent of the adjustment required, because there has never been a pandemic like this. But once you have taken a view of the likely impact, your forecasting solution should allow you to apply it from the top-down. In the Prophecy screenshot above, April and May are in the process of being dialled down by 10 percent. When this forecast change is made, the software will roll it down over the product and customer hierarchies shown, reducing each dependent forecast by 10%.
This is very powerful – you can re-forecast for the pandemic in seconds.
2. Detect exceptions
Many items are likely to suffer from “the toilet roll effect”. In Britain, people panic-purchased toilet rolls to ensure that they had an adequate supply in the event of forced self-isolation. Once it became known that panic-buying was occurring it just caused further panic-buying. At some point, this stock will be used, and sales will dip below the normal rate.
In situations like these, the earlier a change in trend can be detected, the quicker it can be reflected in the demand forecast.
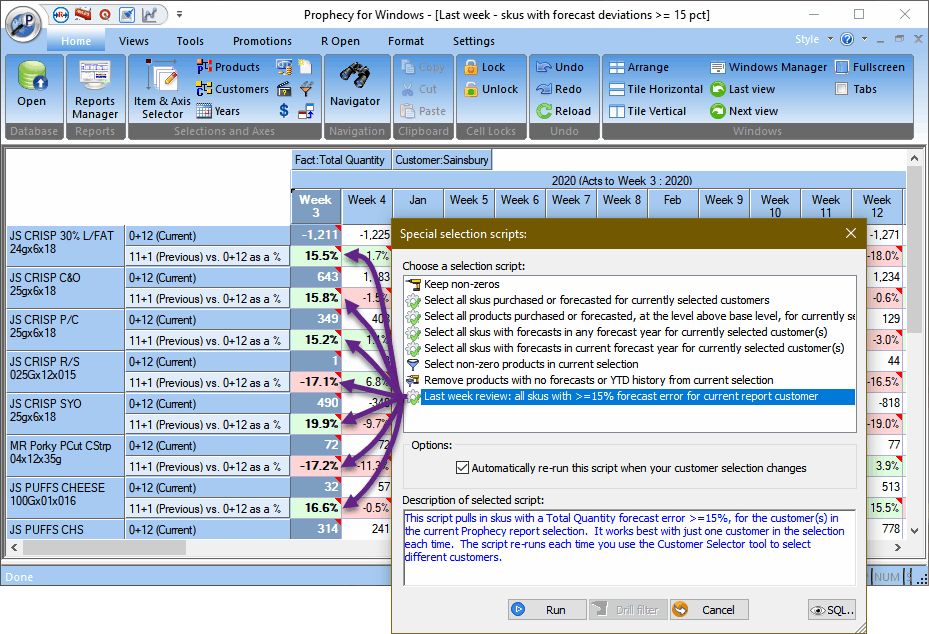
One way your forecasting solution can help you detect exceptions earlier is via data-driven selections. In other words, “show me the items where the latest data is different from expectation“.
In the Prophecy example above, we can instantly pull in all the items which over or undersold by 15% or more last week. If we have point of sale data, we can devise alternative selection criteria.
The point is, statistical forecasting algorithms are of limited use when things are changing so quickly and unpredictably. We have to identify the exceptions quickly, and try to work out the implications on the forecast. Anything your forecasting software can do to help you in this will help you focus forecasting time on actually re-forecasting, rather than the unproductive activity of trying to find the exceptions.
3. Adjusting History
Whilst there is a case for arguing that things may never go completely back to normal as we’ve all learned different behaviours during the crisis, the virus will eventually go, and we will need to create forecasts for new forecasting years.
If we use statistical forecasting, how will it cope with or understand what has been happening with covid-19? It is likely that the disrupted sales history we acquire during the pandemic may span 12 to 24 months. How can we use it to forecast beyond the pandemic?
We definitely cannot just use the pandemic sales data ‘as-is’. Therefore, our forecasting solution needs to be able to ‘clean-up’ history by reversing out the effect of the pandemic disruption from the sales history used for generating future years’ forecasts. Either that, or we may have to consider abandoning statistical forecasting altogether.
Here we can see how Prophecy lets us devise persistent history overrides to take out the coronavirus effects:
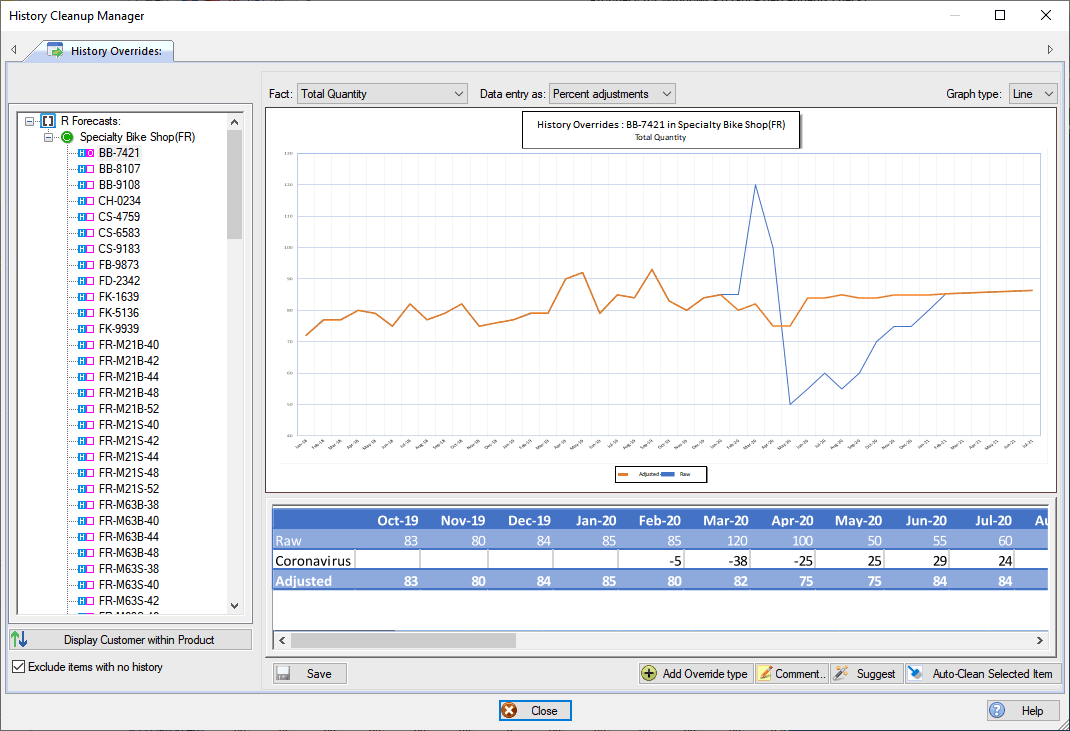
The orange line shows the cleaned up history. Using this data, rather than the raw history shown in the blue line, is likely to generate a much more reliable statistical forecast, for as long as the covid-19 period stays in the sales history.
And because statistical forecasting ideally requires two to three years of data, the adjustments we make now will affect the statistical forecasts we generate for the next two to three years.
Conclusions
Forecasting demand and sales is challenging even in normal times. We live in far from normal times and the effect of the coronavirus will be with us at least into the medium term. No one really knows, at this stage, the duration or overall effect of the distortion. As forecasters, we need to use the best software tools available to help us understand and manage the uncertainty in the best way possible.
