+44 (0)1494 785574
 Failing to learn from your forecasting mistakes makes you a lot less likely to become a better demand forecaster. Measuring forecast accuracy should be a positive thing (and definitely not a stick for beating demand forecasters with).
Calculating accuracy data over hundreds, possibly thousands of items can be a real challenge – especially finding a balanced ‘single number’ measure for accuracy. Here, we explain best practices for calculating forecast accuracy.
Each of these accuracy formula methods are implemented in Prophecy, available with a few mouse clicks. They are mostly well-known, best practice accuracy measures, which represent a single, summary number describing the overall accuracy of a group of many item forecasts.
Before we get to exceptions analysis, let’s remember that summary measurement is useful for tracking accuracy over time. Exceptions analysis – identifying and explaining the reasons for the biggest / most expensive forecast errors – arguably has a bigger payoff. It provides a valuable opportunity to learn from mistakes and apply the lessons of experience to current and future forecasts.
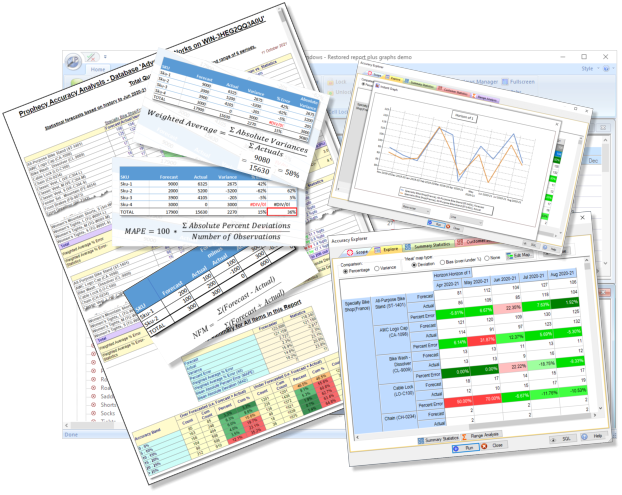
Therefore, step 1 in accuracy analysis should be a process for rapidly identifying the exceptions – the big deviations that caused the most problems. Prophecy’s Accuracy Analysis control dialog lets you specify an exception percent and only items exceeding this limit are listed in the resulting detail report:

Step 1 is to review these exceptions and try to explain them. Could the reasons have been anticipated? Forecasting is constrained to skilfully playing the hand the forecaster was dealt at the time the forecast was made. What’s to learn from reviewing the exceptions? Clearly, if better information or interpretation was available at the time the forecast was made there is a lesson to apply to future forecasts.
Moving on to obtaining a single number to describe forecast accuracy, there are several common measures and a couple of deviated ones. Prophecy’s Accuracy module calculates them ‘for free’ – Excel forecasters will need a little more work but they are mathematically simple.
The important thing to bear in mind when looking at all these measures is that they measure what they measure – i.e. simple maths. They DO NOT measure the real impact on your company’s supply chain or sales, revenue and profit.
This statistic calculates a percentage deviation by dividing the sum of the absolute, unit deviations by the sum of the actuals, as illustrated in the following example:

The ‘simple’ % error, 15%, shown in the ‘TOTAL’ line does not allow for a mix of over and under-forecasts. They cancel each other out and are therefore misleading.
The weighted average method effectively weights the absolute variance by the size of the actual. This gives a more appropriate indication of overall forecast accuracy relative to volume, but assumes a product selling twice as much has twice as much impact. This is not necessarily the case. For example, where one item has a very high price and the other a very low price. In that case, consider measuring accuracy using revenue instead of quantity.
However, if you’re trying to measure supply chain impact, both quantity and revenue can be misleading. Sku-1 could have a long lead time, Sku-2 a short lead time. If they sell the same and are the same price, how can accuracy measures measure supply chain impact?
This calculation is similar to the Weighted Average % Error. However, instead of dividing by the sum of the actuals as shown in the example above, it divides by the sum of the forecast or actual for each line, whichever is greater.

This means that actual=0/forecast=100 has the same weight as actual=100/forecast=0. For two items with these forecasts and actuals, the weighted percent is 200% (misleadingly high?) whereas the Alternate Weighted percent is 100% (perhaps closer to ‘correct’ because both items were effectively 100% out?).
The Alternate Weighted Average % approach was suggested by a Prophecy customer and is thought to be non-standard. Nevertheless, it has the stated advantages over the more usual calculation.
This is a commonly used measure in demand forecasting. It is the mathematical average of the individual percent errors, ignoring their signs, as shown in the cell outlined in red here:

It is a moot point whether to divide by 3 or 4 in the example shown, where Sku-4 has no actual. If you divide by 4 you are rewarded with a lower MAPE than dividing by 3, but if you divide by 3 you are effectively ignoring Sku-4!
In addition, this method gives equal weight to a percent deviation, irrespective of the relative size of the forecast or actual. An item that sells a million has the same weight as one that sells 10.
This measure definitely has the most appropriate acronym! It is calculated from the mathematical average of the individual unit deviations, regardless of their sign:

The advantage of MAD over MAPE is that instances like Sku-4, where there is no actual, are included in the measure. The same percentage error on a high volume item has a much bigger effect on the result. This may or may not be desirable where, for example, the high seller is low value and the low seller is high value.
In addition, unlike a percent measure, it can be hard to know if the MAD is good or bad – it is just a number.
Forecast bias refers to the consistent and persistent deviation of predicted outcomes from actual results over time. It represents a systematic tendency for forecasts to consistently overestimate or underestimate future values. Understanding forecast bias is crucial as it helps organizations and analysts recognize patterns in their forecasting methods.
Forecast bias is covered in more detail in our knowledgebase article, "Forecast Bias in Forecast Accuracy Measurement".
As with so many areas of demand forecasting, there is no right answer or single ‘best’ measure that can be used to describe demand forecasting accuracy.
The first and most beneficial purpose of accuracy analysis is to learn from your mistakes. In that sense, exceptions analysis has the highest return. The summary measures are helpful for tracking cumulative improvement over time and are control barometers.
Our free online forecast accuracy calculator runs in your web browser, transmits no data over the internet and calculates all of the above forecast accuracy measures. You can copy/paste your data into the calculator, type it in or load it from an Excel spreadsheet file.
The format of your data is as simple as we can make it - each line must contain a description (e.g. product), a forecast and an actual.
Looking to increase your forecasting accuracy measurement focus, but tired of the headaches of time-consuming calculations?
On demand forecasting accuracy measurement is just one of the many benefits for demand forecasters baked into our software, Prophecy. Please check out Prophecy Accuracy Measurement briefing page for example screens and insight into the value Prophecy can add to forecast accuracy measurement.