
Screenshots - Prophecy demand forecasting software
Click on a thumbnail to view it full size.'Report'=Update screen
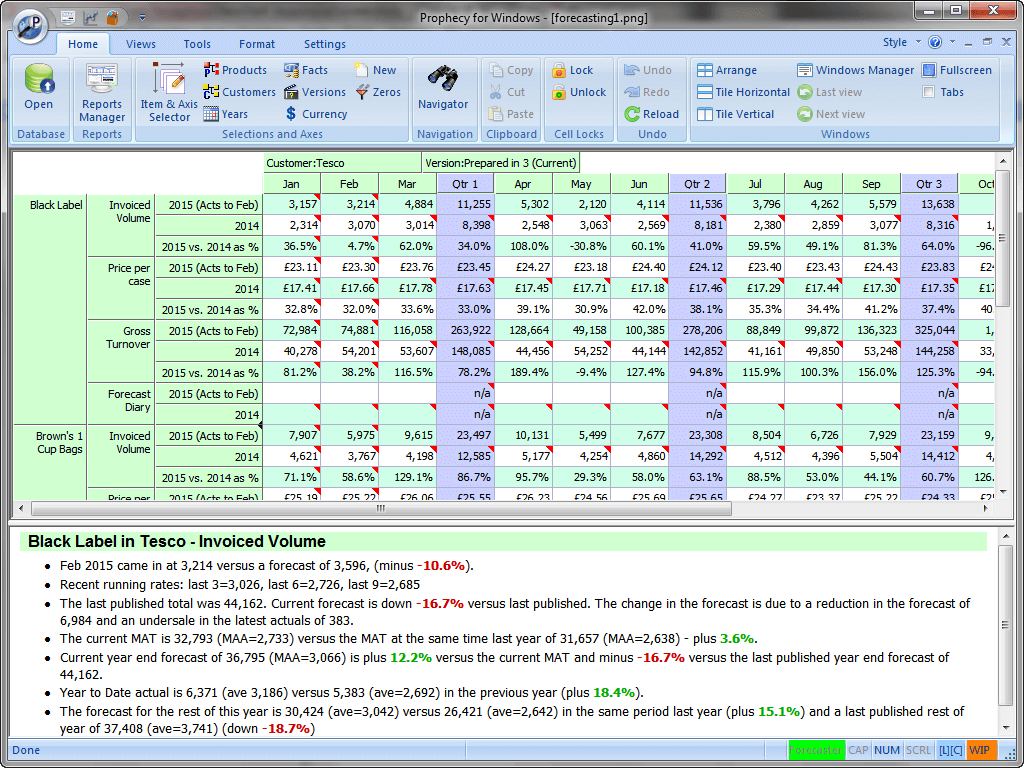
Note that every Prophecy view of the demand forecast is read-write, subject to the user's security profile.
Prophecy screens can show any item on any axis, just like Excel pivot tables.
The 'Prophecy Advisor' text in the lower pane is generated automatically and in real time by Prophecy as you enter demand forecast changes.
The 'Prophecy Advisor' also identifies individual forecasts which are outside previous sales history.
(The Advisor window can be hidden if preferred!)
Navigation made easy
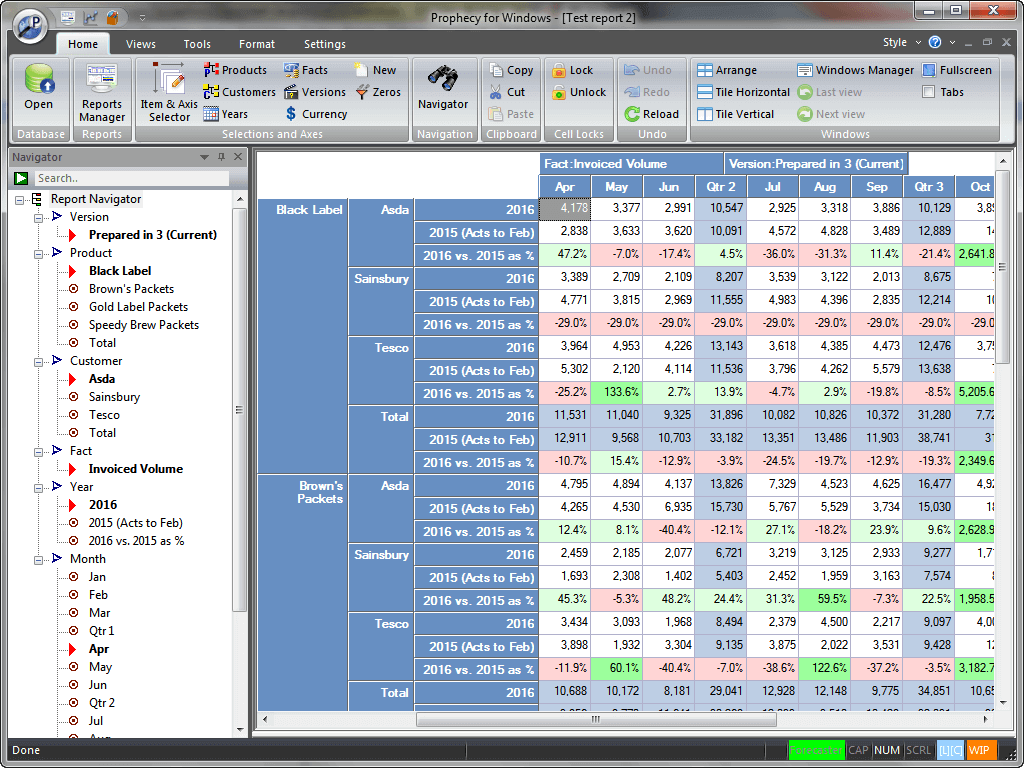
Another view of the main Prophecy screen, with a different report/update screen and the Navigator window to the left.
The Navigator helps you find items instantly in large reports without needing to scroll the report manually.
You can quickly drill down to the 'children' of a row, column or paged item by double-left clicking. Double-right clicking drills up to the 'parent' item.
Live graphs
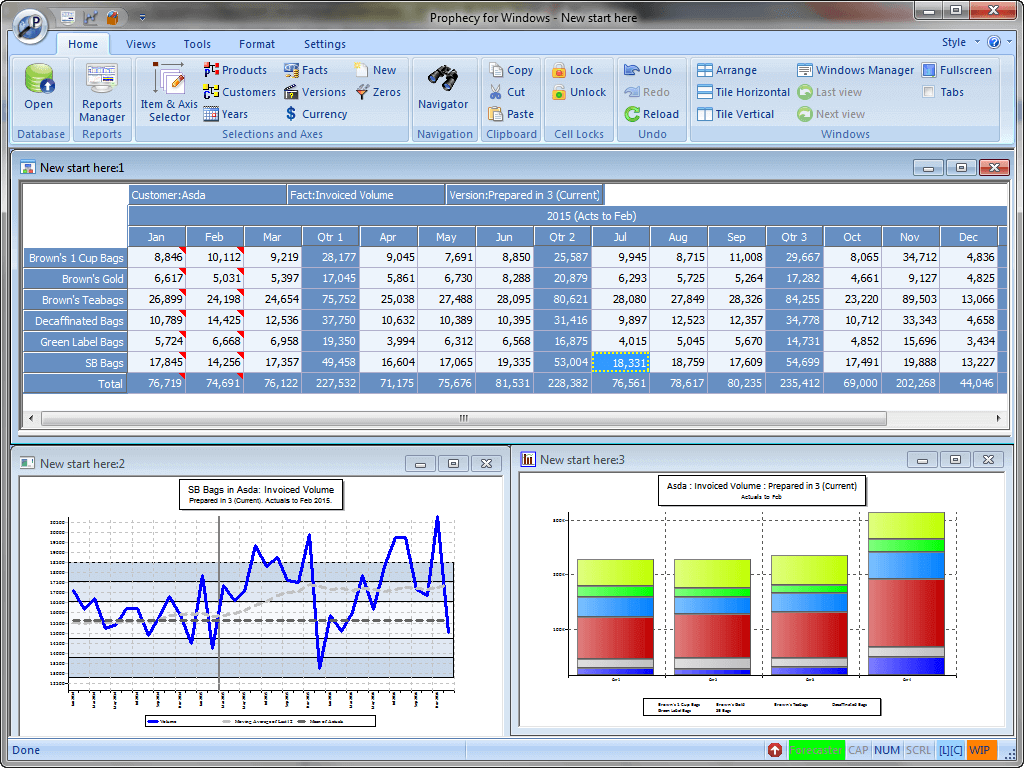
This image shows a Prophecy report / update screen with two supporting graphs.
The graph on the left shows the full time series and moving average for the item at the current cursor position in the main report.
The graph on the right shows a selection of cells from the main report.
Both graphs are updated 'live' as you navigate the report and change the forecasts.
Promotions View..
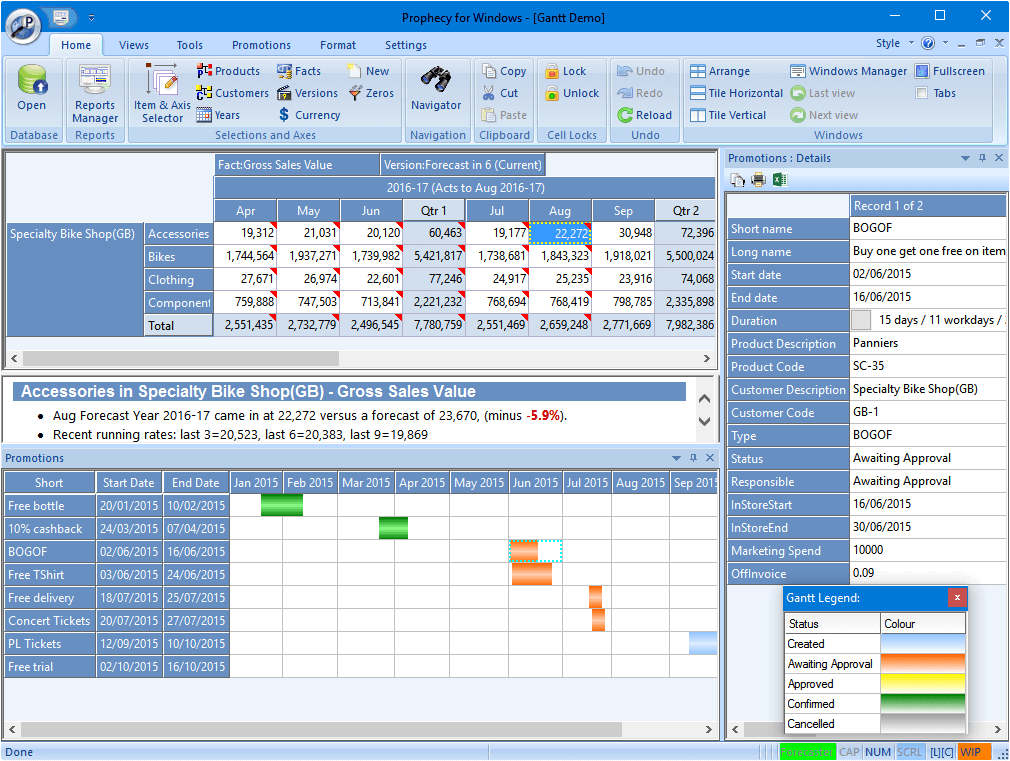
This screenshot shows Prophecy's promotions view, immediately below the main Prophecy data-entry view.
The gantts correspond to the promotions for the items in your current report.
Prophecy's Trade Promotions Planning module supports the full promotions lifecycle - forecasting, approval workflow, league tables, promotional evaluation etc..
Statistics View..
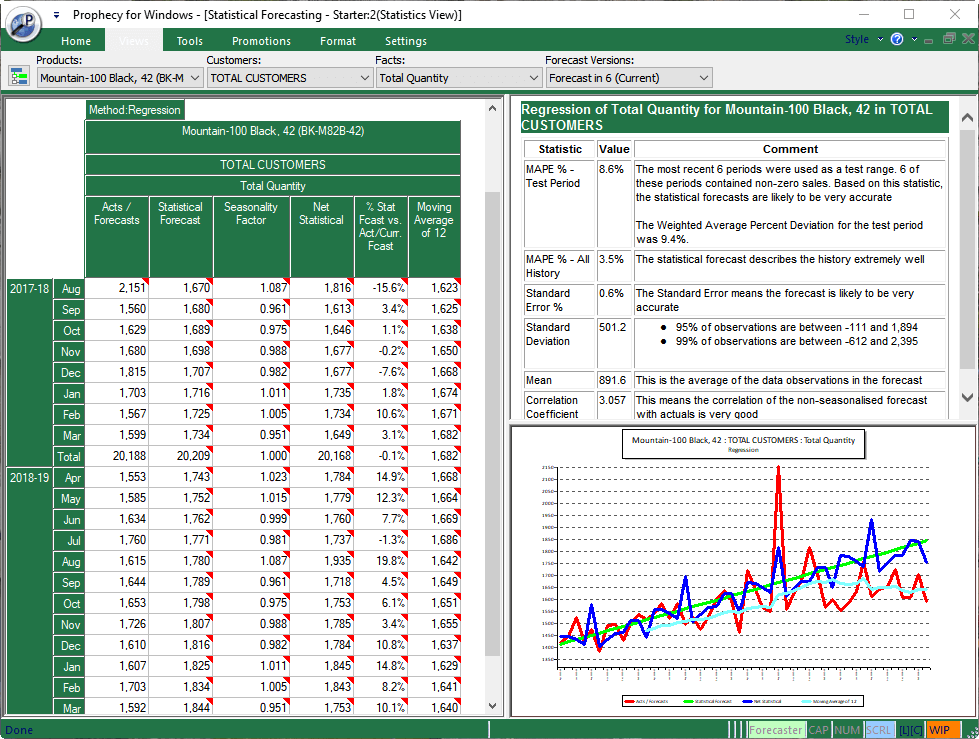
The Statistics View is just one of the ways that Prophecy' statistical forecasting engine is used. There is also a 'Batch Mode' and a cell forecaster 'Wizard'.
The table at top right of the image is 'written' by Prophecy and explains the statistical measures in plain English.
The graph shows the statistical forecast versus the current forecast and the moving average.
Each 'pane' in the view can be resized.
This view follows the main report view shows in the other screenshots. It is refreshed with a forecast relating to the item the cell cursor is on within the main view.
Selecting Products..
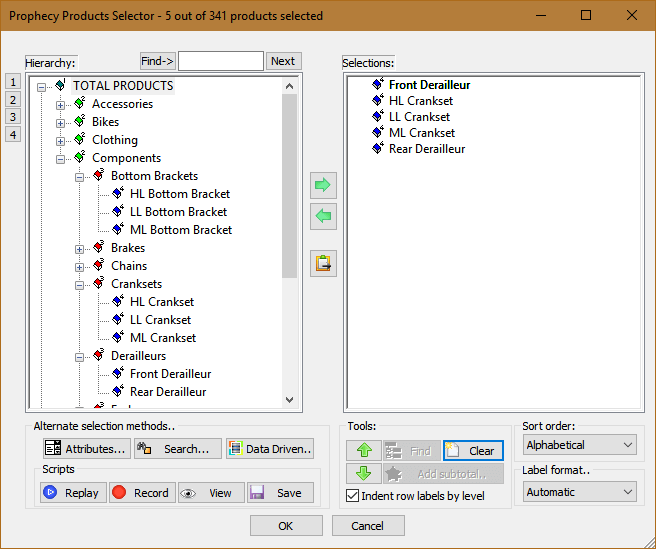
The full hierarchy is on the left and the items in the current view are on the right. You can show codes, labels or build your own labels.
This database contains only 4 hierarchy levels for products. However, you can have up to 15.
Quickly select products from the hierarchical view, by parentage, by attribute (e.g. 'colour', 'flavour', 'supplier' etc.), by data-driven criteria or by text search.
Product selections are stored either as lists or scripts in saved reports. Scripts based on data-driven criteria re-evaluate each time they are run.
Selecting Customers..
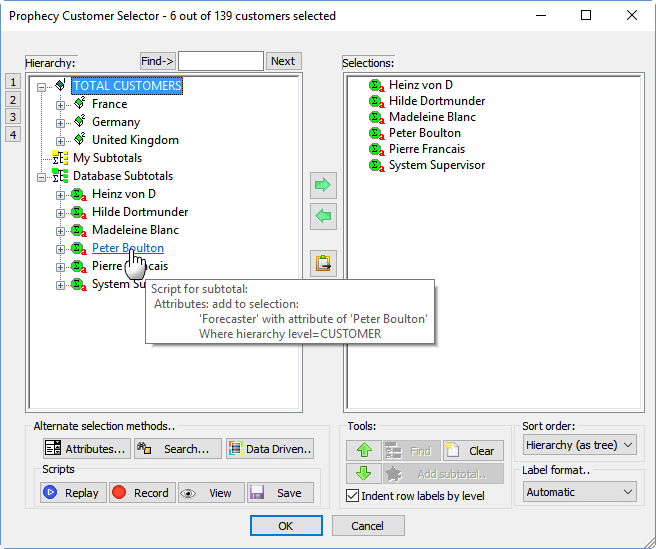
The Customer Selection tool. Works exactly the same as the Product Selection tool in the preceding image.
Notice the "My Subtotal" which uses a selection script (like a macro, created by click and point, shown in the tooltip).
Customers and products can also be given 'attributes', which allow items to be selected based on common properties rather than their positions in the hierarchy.
Workflow / Multi-User
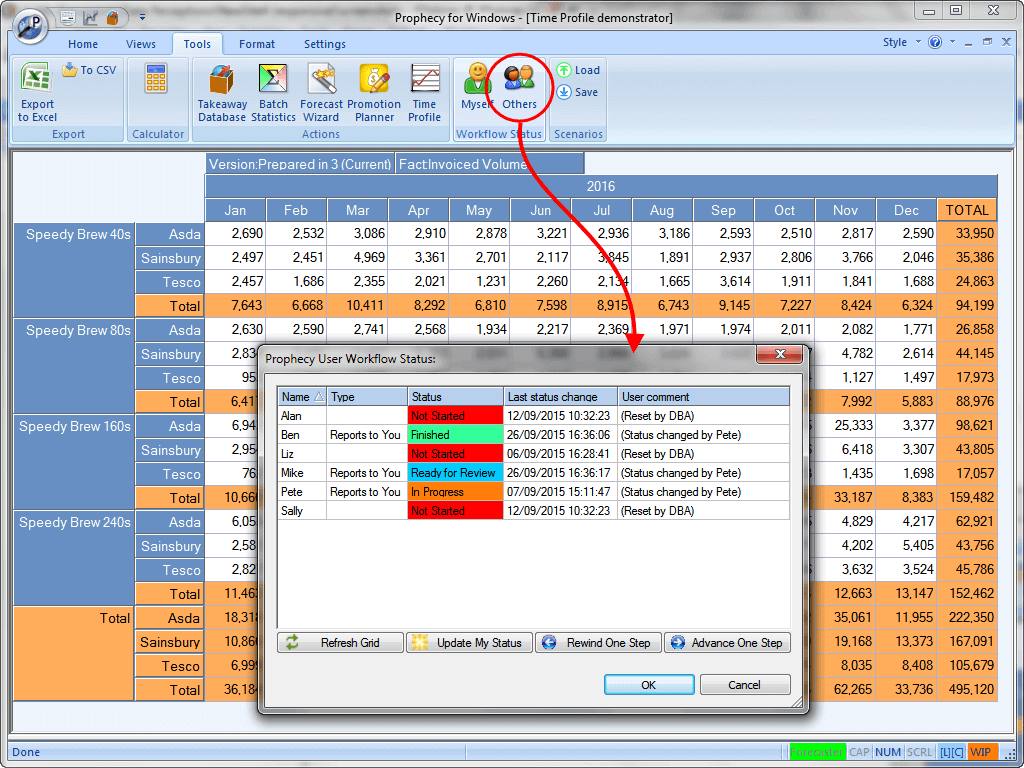
Another Prophecy report showing some of the tools available to forecasters.
The dialog box shows part of the Workflow Management feature in Prophecy - which lets you manage, control and coordinate the forecasting process over numbers of forecasters and reviewers.
Trade Promotions
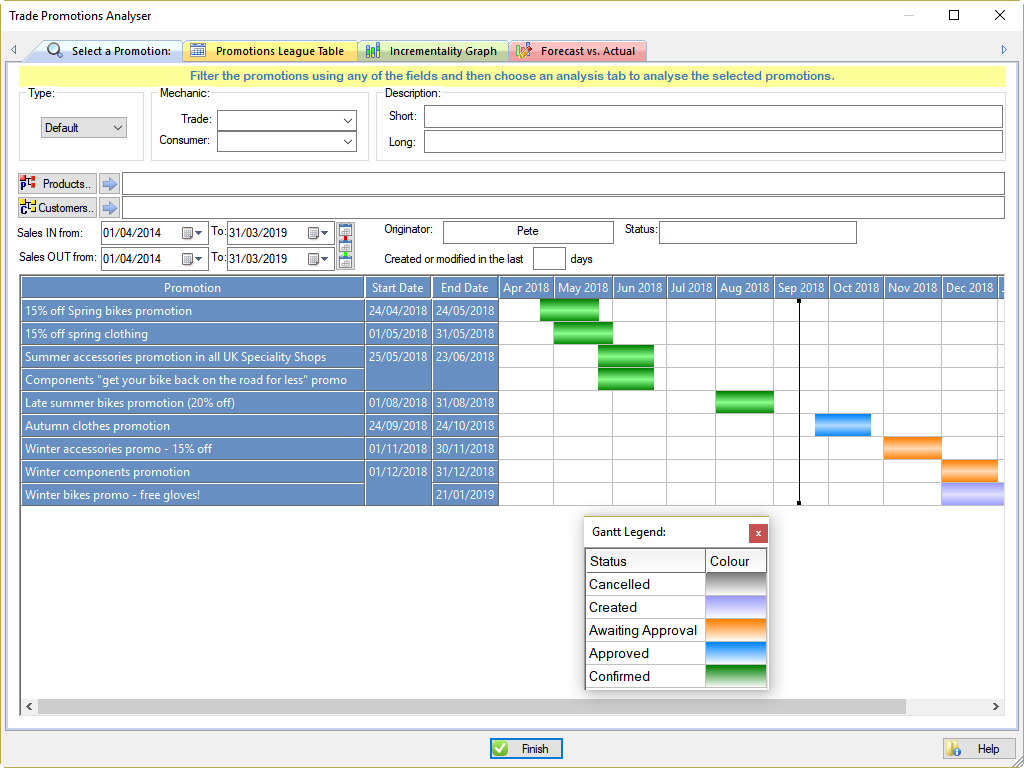
This image shows the Prophecy Trade Promotions Module's 'select promotions' option.
You can display edit and analyse any selection of promotions in this view by entering filters in any of the fields - originator, products, customers, time range etc..
Prophecy supports full multi-user workflow around the planning and execution of trade promotions, plus incrementality analysis, all within the standard Prophecy demand forecasting software environment.
Choose your demand forecasting Measures
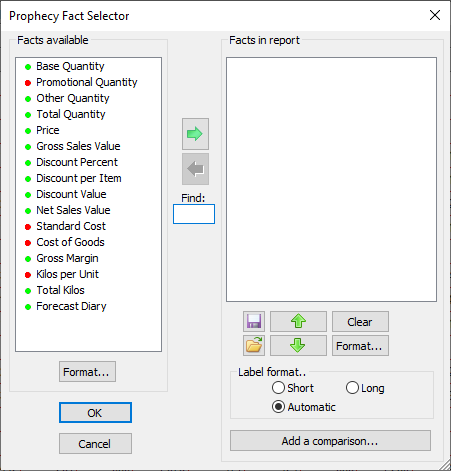
The measures in your Prophecy database are configured in the database set-up.
This dialog box lets the forecaster choose from the available measures, so that only the measures they want to see in their report are presented.
The list on the left is the list of available measures in our example database. Moving measures from here to the right-hand list causes them to be displayed in the Prophecy report / update screen.
You can also use this dialog box to set up 'on-the-fly' comparisons - such as Gross Margin as a Percent of Sales Value, etc..
The small red or green dots next to each measure indicate whether the forecaster has read-only or read-write rights to the measure. (In addition, measures can be completely hidden from a forecaster in the database setup.) With the measures you see in the example, this forecaster can back-solve from Gross Margin or Kilos. Prophecy will re-calculate Quantity, Value and Margin based on the existing Price, Discount Percent and Standard Cost values.
We also have a Youtube page, which contains video demos of some of the more specialised demand forecasting and statistical forecasting features of Prophecy.