
demand forecasting Measures
Use Prophecy™ to forecast Quantity Extend to Revenue via Selling Price, Extend to Profit via Discounts and Cost of Goods.
It is possible to configure your Prophecy database to support the forecasting of virtually any measure. For example, forecast in cases or units or tonnes or litres in addition to the financial measures like revenue, costs, discounts and margin. Prophecy solves the other measures using pre-supplied conversion factors for each item, and then extends through price, standard cost and, if relevant, discounts, to get to gross margin.
You can even back-solve (subject to your permissions) from, say, Revenue or Kilos and Prophecy will solve back to Volume, keeping price and the other per-unit facts the same.
Forecast multiple measures together, pivot-table like
Prophecy forecast screens are fully multi-dimensional, like Excel pivot tables. Unlike Excel they support data entry, full back-solving (goal seeking) and drill down/up navigation through the whole Prophecy database.
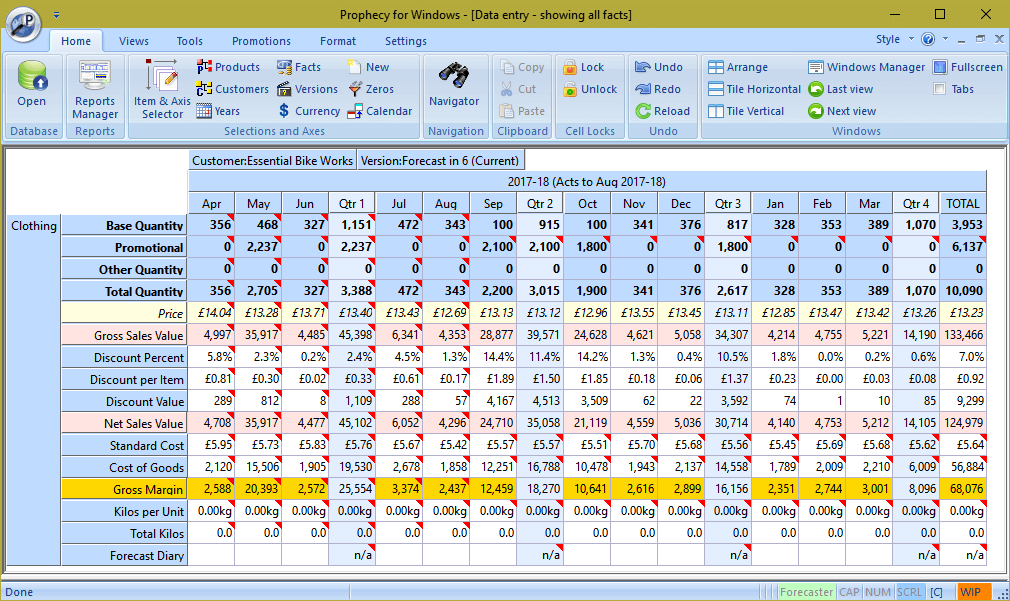
Working from the top of the image, you can see the three components that add up to Total Quantity : Base plus Promotional plus 'Other'. (Some forecasters like this separation. Alternatively, you could simply forecast with 'Total Quantity'.)
Tailored for your database
Forecast measures are fully tailored for each Prophecy™ database. The measures in the screenshot are simply an example of what is possible.
In addition, you don't have to display all the measures in your forecasting screen : simply choose the measures you want to see, using the 'Facts' selector tool.
Below the quantity measures, you can see the explosion through sales to gross margin, with
Kilos as an additional measure.
The cells containing ' ' in the top right hand corner are read-only. All the other cells are forecastable. That means that, providing the forecaster has permission to change the customer, product and measure combination, they can change total cells, price cells, even sales value or gross margin cells. Prophecy instantly solves all the dependent measures and totals when a cell is reforecasted. (Note: These functions can be switched on and off on a per-user basis.)
Here is an example from a different database, showing just a selection of the available measures.
It can still be used for data entry. Unlike Excel forecast spreadsheets you can include
only the measures you want to see at the time. Adding to or changing the displayed
measures is achieved with literally a few mouse clicks on the Facts Selector
tool.
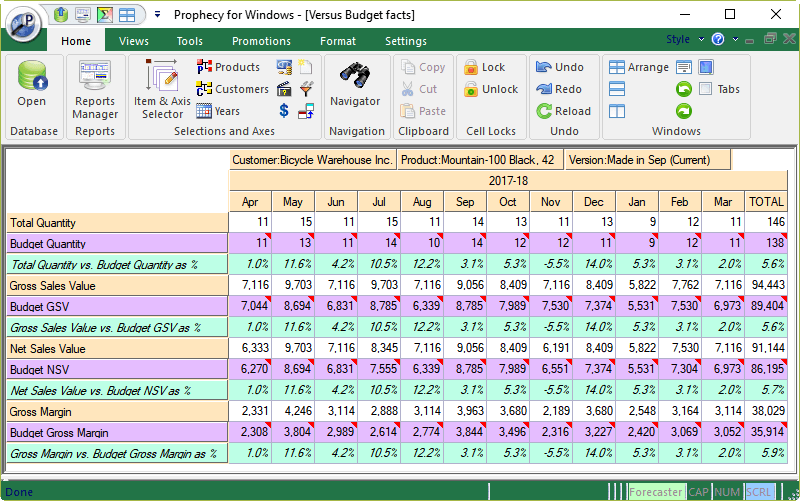
Notice how the percent comparison cells in this example report do not contain read-only indicators. You can change the value of any comparison cell and the corresponding forecast value cell will recalculate to meet the new percentage difference you've entered. (Again, as with most of Prophecy, this is a feature that can be selectively deployed or made non-available if required.)
Summary
Prophecy lets you build a demand forecasting database containing exactly the measures you need for your business. Multiple volumetric measures, extended through revenues and profits if required, it's up to you.
This flexibility allows Prophecy to meet most demand forecasting and planning requirements and allows your forecasting solution to grow and evolve with your developing business requirements.