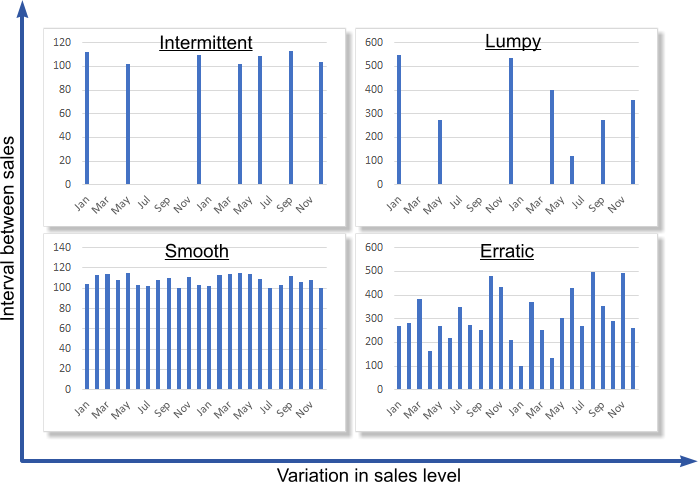
Some products have steady sales, whilst others are highly erratic. Some are ordered intermittently (i.e. long gaps between orders) but each order has a similar quantity, whilst other products are ordered intermittently with highly variable quantities.
An item's demand characteristics provide inferences on how it can most effectively and efficiently be forecasted. Prophecy's August 2019 release adds a new analysis view that mathematically categorises items based on their 'forecastability'.
Forecastability theory* scores a product's demand characteristic on two measures:
Therefore an item can be categorised into one of four quadrants:
Each quadrant has implications on how easily an item can be forecasted and also how it can be most effectively forecasted. Specifically:
Forecasting literature recommends measuring demand level variability using the Coefficient of Variation (a measure of dispersion from the mean). Demand intervals are measured as an average. For example, if there are 24 periods in the history but only 6 have sales then the Average Demand Interval (ADI) is 24 / 6 = 4.0. So, if there are sales in every month then the ADI is 1.0.
There are recommended thresholds for using these measures to determine forecastability quadrants, as shown in this screenshot, although you can change them as required.

The red lines dileneate the quadrants corresponding to each category. A pop-up tooltip appears when you hover your mouse over white space in a quadrant, identifying the quadrant. Another tooltip appears if you hover the mouse over any plot point, showing that plot point's product/customer.
The Forecastability Analyser can present the same data as a 'bubble chart', where the size of each bubble corresponds to the average sale per period.
The button group labelled 'Push into Prophecy Report' on the screenshot lets you push the items from a chosen forecastability category into the current Prophecy report (replacing the existing selection) so you can start working with them as a group. You don't even need to close the 'Forecastability Analyser' window, as it's actually a floating window that runs in parallel with Prophecy's main window.
A potential workflow is (for example) to push all 'Smooth' items into your Prophecy report and then use Prophecy' s R Open automatic statistical forecasting to generate forecasts for these items.
You could push the 'Erratic' ones into the Prophecy report to analyse for seasonality. The MAPEs generated from running these items through Prophecy' s R Open automatic statistical forecasting can be analysed and, where the MAPE infers a reasonable forecast can be obtained, these items can be statistically forecasted. (A low MAPE implies that the statistics algorithms successfully identified the seasonality in the history and applied it to the resulting forecast.)
The remaining 'Erratic' items are likely to be heavily promotional and will need to be forecasted as such.
Finally, where items appear 'unforecastable' (i.e. 'lumpy' - high variability in sales and high interval between sales) then consider forecasting at a more aggregated level (of customer) to even out the spikes if smoothing the customer ordering pattern is not possible.
'Forecastability Analyser' is one of many ways Prophecy tries to help you produce a better forecast, more productively. We welcome enhancement suggestions, so please help the Prophecy developer make Prophecy better for you and all the other Prophecy users by communicating your suggestions, either through email of our web site contact form. All feedback welcomed.
Web: https://dataperceptions.co.uk. Phone: +44 (0)1494 785574
Visit https://dataperceptions.co.uk
Call +44(0)1494 785574