
+44 (0)1494 785574
The 80:20 rule states that, in many cases, roughly 80% of effects come from 20% of the causes. The business management thinker, Joseph M. Juran, first expressed the rule and named it after an Italian economist called Vilfredo Pareto.
Applied to business, the Pareto rule states that 80% of quantity / revenue or profit typically comes from the top 20% of customers and the top 20% of product skus typically account for 80% of quantity / revenue or profit:
Figure 1
It can be surprising to discover how ‘classically’ the customer portfolio fits the 80:20 rule. And, if it does, there are clear savings from forecasting smaller customers in pre-aggregated groups and larger customers as separate forecasting entities.
The same graph can be applied to products. The top 20% of skus typically account for 80% of sales. Focussing more time on forecasting those skus as a result of the time savings obtained from forecasting smaller skus less often or in more automated ways will improve the accuracy of the forecasts whose accuracy is most critical to the business.
If you find that the 80:20 rule applies to your business – and there is a high probability that it does – then there are some really beneficial changes you can make to your forecasting processes which will:
If you haven’t performed the 80:20 analysis on your company’s data before and are unconvinced that the 80:20 rule applies to your data we’d encourage you to put it to the test – you might be surprised!
To make it as easy as possible to complete the analysis we have prepared a simple spreadsheet, which you can download from http://www.dataperceptions.co.uk/whitepapers/80-20template.xls.
To populate the spreadsheet all you need to do is source a simple 2-column report, where column A is the customer and column B is their sales over the analysis period and then paste the result into our spreadsheet, as shown in Figure 2 below:
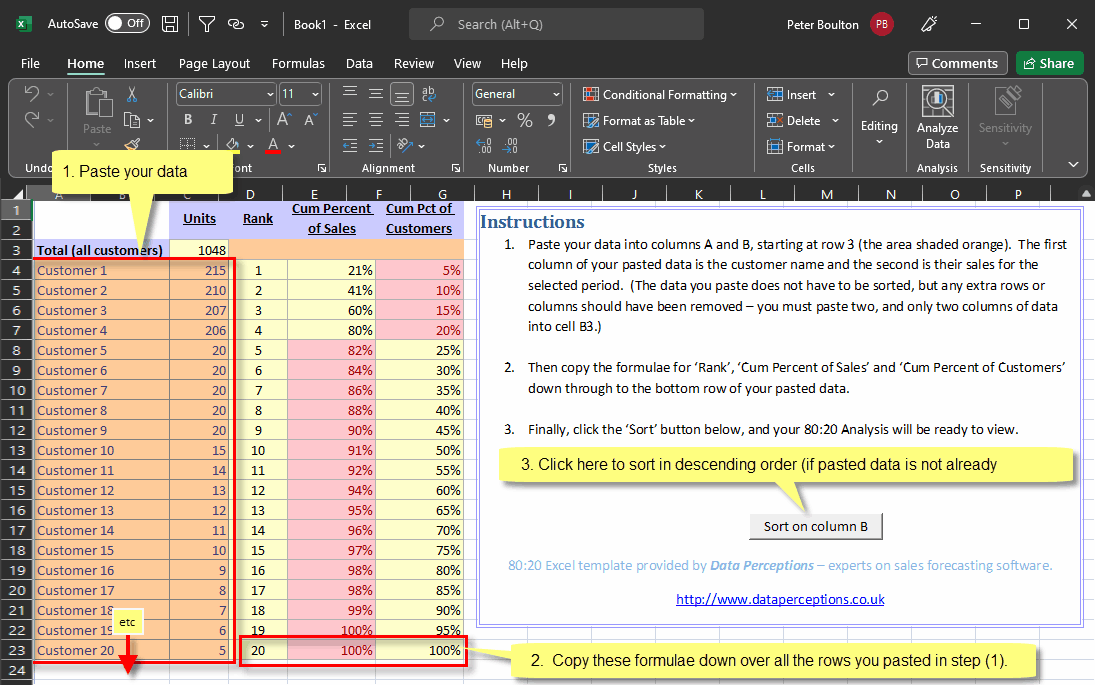
Figure 2
Once the pasted in data is sorted in descending order as shown (by clicking the button labelled ‘Sort on column B’), columns D and E will show the 80-20 cut-off point. In Figure 2 you can see that the top 4 customers equate to 80% of sales and account for 20% of total customers – the expected Pareto result.
The rest of this article will suggest ways in which the 80:20 rule can be applied to improve the process of business forecasting. The basic message will be “less is more”. In other words, the fewer numbers you forecast, the more time you will have to get the ones you do forecast right. And the ones you do forecast should be the big ones, those which have the maximum business impact.
Given that around 80% of sales are accounted for by around 20% of customers, what changes can you make to the forecasting process to make it more effective?
The first point to make is that, unless you are happy to produce daily, weekly or monthly forecasts by product exclusively using statistics and without manual adjustment, then the activity of forecasting is potentially a highly time-intensive process. The more time you spend on it, the more likely you are to generate the most accurate possible forecasts.
There are separate articles on the relevance of statistical forecasting in real-world forecasting available in our Knowledgebase so we won’t specifically address that debate here. However, whether you start the forecasting process each cycle with statistical forecasts or with ‘judgemental’ forecasts, the fact is that ensuring that all known events are carefully built into the forecast is a time-consuming activity.
The people who are best placed to perform this activity – often the sales or marketing managers – have limited time available for forecasting.
Therefore, the fewer actual numbers each forecaster has to forecast, the more time they can spend on each number and the better chance they have of making the forecast as right as it can be.
Improvements in the forecasting process can be made by developing a “less is more” strategy to the results of the 80:20 analysis. To implement that improvement the 20% of customers who account for 80% of sales should be handled differently to the 80% of customers who account for 20% of sales.
Forecasting small customers individually is difficult for the following reasons:
One option is to forecast these customers individually using statistics. However, the lumpiness of demand makes statistical forecasting at this level of detail difficult. Most statistical algorithms smooth through the irregular history when extrapolating into the future. For more information, please view our Forecastability knowledge article.
The solution is to pre-aggregate the small customers into sensible industry or trade groupings and to forecast them at this level. This has two major benefits:
An additional benefit of this approach is that it encourages the business to think and plan for specific industry groups rather than an amorphous group of miscellaneous, individually small customers.
Further time savings accrue for this group when you consider that larger errors in the forecasts will have a smaller impact on the business. You may therefore decide to forecast or review the groups less often than the major customers, or by exception.
The short term peaks and troughs in sales in the top 20% of customers can be large and irregular through time. They are caused by a combination of promotions, competitor activity, customer logistics etc..
The key to forecasting these customers is applying the business manager’s knowledge and interpretation of the factors which have caused the peaks and troughs in the past to known future plans and activities. It’s a time thing.
Therefore the majority of the forecasters’ time should be spent on the 20% of customers who account for 80% of your sales. That way, more time can be spent on each forecast because there are fewer of them.
Focussing efforts on the major customers means that small improvements in forecast accuracy will have the biggest business benefits. A short benefit to express in words but a big benefit for your business!
There are spin-off benefits too. Typically there are more tactical opportunities to increase business with key customers. Making them the focus of the forecasting process helps to integrate the process of forecasting with the process of planning for sales. This integration concentrates resource at all levels into refining and optimising the business plan. The demand forecast is only one of the outputs (benefits) of this process.
Some of this logic applies for products too, though in Data Perceptions’ experience some form of formal or informal product categorisation is already made in forecasting and production planning in many customers.
The top 20% of products that account for 80% of sales are typically hard to forecast because they can be highly promotional, competitive or seasonal and should be forecasted / reviewed as regularly as possible.
The remaining 80% of products could be forecasted less often, or an initial forecast could be re-visited by exception using forecast accuracy analysis.
However, it should be born in mind that there may be other considerations when applying the 80:20 rule to products. Perhaps the lead time for components on a ‘small’ product means that, in actual fact, a high degree of forecast accuracy is desirable, whereas production is very flexible on the fast sellers.
So, blind application of the 80:20 rule to products would possibly be inappropriate. However, seeing how the products lie within the 80:20 distribution may help to clarify where efforts should be applied in the product forecasting process.
Optimising a forecasting process always requires compromise, because there is potentially a near-infinite number of numbers that could be forecasted and a (very) limited time and resource with which to forecast them.
In our experience of real-world forecasting, the mistake which is made most frequently is to try to forecast at too great a level of detail. Somehow more detailed forecasts are equated with ‘better’ forecasts. Forecast at a level of detail you stand a chance of getting right and which has the maximum impact on your business wherever possible. Additional detail on low impact numbers just creates meaningless and distracting ‘noise’ for your business.
Use the 80:20 rule to concentrate resource towards the areas of maximum business impact. ‘Forecast Less Not More’ really can work!
The 80:20 rule, especially applied to your customer portfolio, offers a great opportunity for improving your forecasting processes.