What's new in Prophecy?
Prophecy has been under continuous development since before 1998! This page was created in June 2013 and summarises the changes to Prophecy since then.
| Date | Version | Enhancements |
|---|---|---|
| 11th April 2023 | 12.3.0.0 |
|
| 8th March 2023 | 12.2.0.0 |
|
| 27th June 2022 | 12.1.0.2 |
|
| 20th May 2022 | 12.1.0.1 |
|
| 25th August 2021 | 11.14.0.0 |
|
| 15th July 2021 | 11.13.0.0 |
|
| 18th March 2021 | 11.11.2.0 |
|
| 3rd March 2021 | 11.11.1.0 |
|
| 9th December 2020 | 11.11.0.1 |
|
| 23rd November 2020 | 11.10.1.0 |
|
| 16th November 2020 |
11.10.0.0 |
|
| 22nd September 2020 | 11.9.0.3 |
|
| 7th September 2020 | 11.9.0.0 |
|
| 16th April 2020 | 11.7.4.0 |
|
| 16th April 2020 | 11.7.2.0 |
|
| 26th February 2020 | 11.7.1.0 |
|
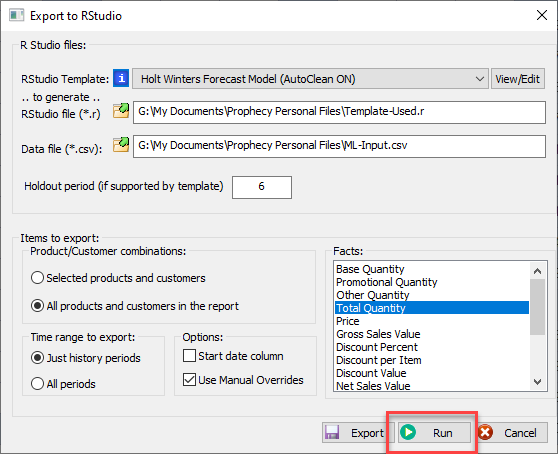
| 5th February 2020 | 11.7.0.0 |
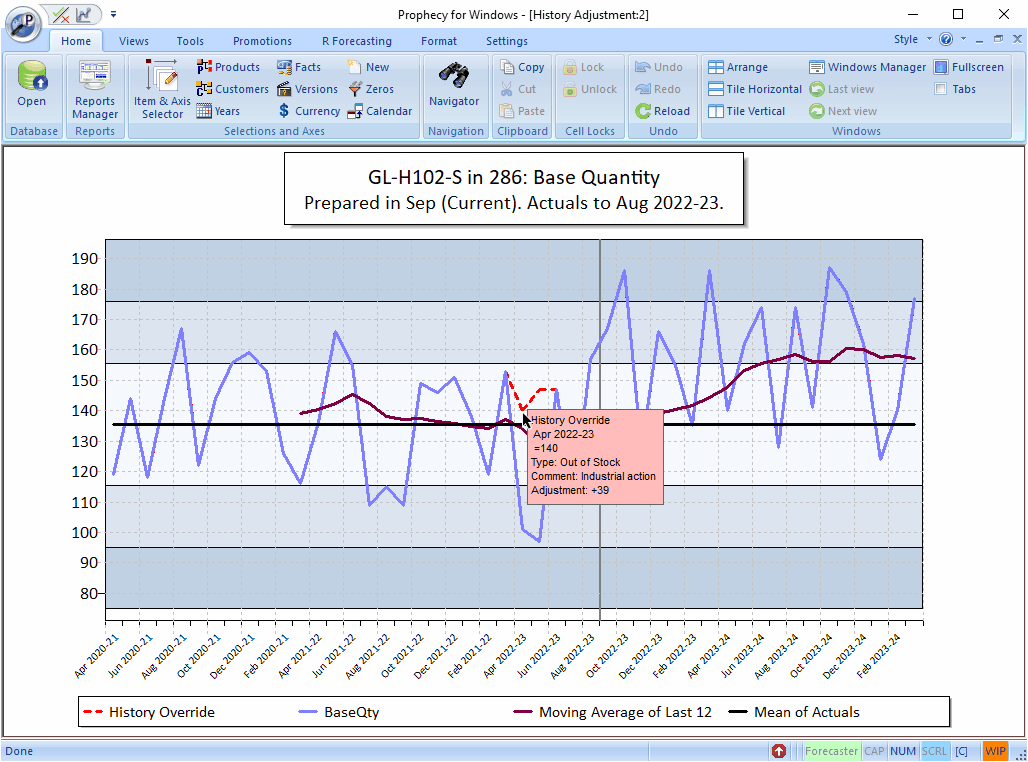
Prophecy's R statistical forecasting already has the option of automatic history cleansing, using R's sophisticated tsclean method. However, in addition, this release adds the option of creating manual history overrides to the sales history used as input into R to forecast generation. Please note that the history you see in your Prophecy reports will always be the actual, as it happened history. The overrides you create with the 'R Open' / 'History Cleanup' option can be viewed and edited within the History Cleanup Manager and are used only for improving (hopefully!) the quality of statistical forecasting. |
| 20th November 2019 | 11.6.0.0 |
|
| 11th September 2019 | 11.4.0.2 |
|
| 28th August 2019 | 11.3.0.5 |
|
| 18th July 2019 | 11.3.0.0 |
Major new feature - Forecastability Analyser added to 'Views' tab. The new Forecastability Analyser view auto-categorises product/customer combinations based on the variability of their sales level against the 'density' of sales by period. Based on plotting these two measures, an item can have demand that is 'Intermittent', 'Lumpy', 'Smooth' or 'Erratic'. Each classification has implications on how to forecast the items within it. 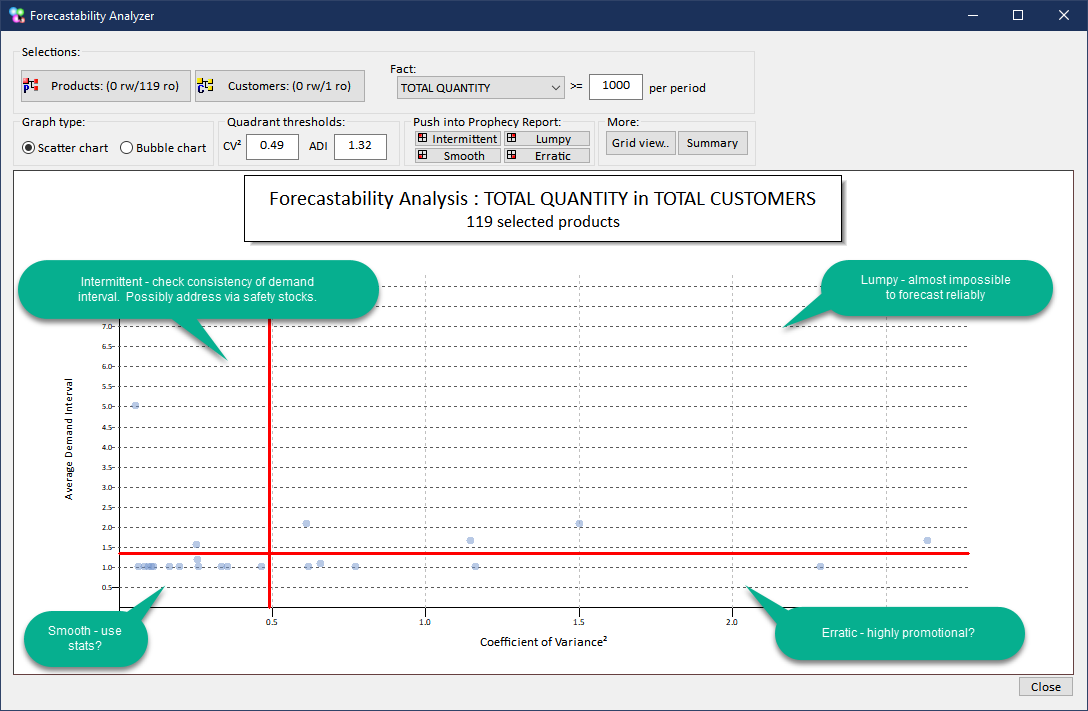
For example, items classed as 'Smooth' have regular sales at a similar level through time and are therefore excellent candidates for automatic, statistical forecasting. At the opposite end of the forecastability spectrum, items classed as 'Lumpy' have irregular and highly variable order quantities and it is unreasonable to expect accurate forecasts from statistics or human forecasters, unless the human forecasters can access additional information from the customers. The new view adds value because it helps you decide how the different items can be most effectively forecasted. There is much more information on this analysis in the new online help file. Just press F1 when you have your first Forecastability Analyser view in the screen for a full description. Performance Improvement on Product and Customer Selector tools There is a many-fold speed-up on large selections resulting from data-driven selections, pasted in selections and 'children of..' selections from the right-click menu in the 'Selected items' list box. Accuracy Explorer - editable accuracy bands. The accuracy bands are now editable and we have added an extra band! Vertical Axis range logic improved on Prophecy Graphs The vertical axis on Prophecy graphs no longer starts at zero. Instead, it starts at (slightly below) the minimum graph series value. This makes the peaks and troughs in the graph series much clearer. |
| 11th June 2019 | 11.2.0.0 |
Major new feature - Accuracy Explorer added to 'Views' tab. Accuracy Exporer lets you analyse demand forecasting accuracy over many time periods, for one or more pre-determined forecast horizons. For example, in one analysis track the forecast made in November for January, December for February, January for March etc.. Separate results grids are shown for:
The grids are fully multi-dimensional and the report axes can be freely re-oriented using right-click and drag, just like standard Prophecy reports. Together, these analyses provide an unparalled view of overall forecast accuracy. The new Accuracy Explorer option does not replace the existing 'Accuracy Report' option. Running an Accuracy Report on last period, using it to identify / understand the biggest forecast deviations, is a great starting point at the start of the forecasting process each period. Accuracy Explorer, on the other hand, is helpful in identifying longer term forecast accuracy characteristics and bias in the forecasts. Note: this feature is enabled for Prophecy databases hosted in Microsoft SQL Server and is not available in 'file-mode' or 'Takeaway' databases. New feature - 'Instant Graphs' anywhere You can now generate an 'Instant' graph from any range of selected cells, in any Prophecy report, including standard Prophecy reports, Accuracy Explorer views, R Forecast results views and TPM views. Just select the cells you want to graph and press Ctrl+Space on your keyboard (or right-click and choose 'Instant Graph' from the menu). Instant Graph windows 'float' - i.e. you can generate an instant graph, move and resize its window whilst continuing to use Prophecy as usual. Any number of instant graph windows can be created. Fixes and Minor improvements - cumulative minor fixes and improvements. |
| 27th March 2019 | 11.0.0.8 | Improved graph layout - x axis label font a little larger.
Title box font scaled down for very long titles so that
box does not extend off-screen. Forecast bias table
at the bottom of Prophecy accuracy analyses now deploys
' heatmap' colouring to aid interpretation and adds cumulative
data columns to the table. On the product and customer selectors you can now deselect, as well as select, children or descendants of the selected items using the right-click context menu on the right hand listbox of the product and customer selector tools. |
| 27th February 2019 | 11.0.0.5 | Minor improvements and fixes to Statistics View and Forecast Wizard. Improved time labels in Prophecy Advisor text for databases whose years are not Jan-Dec. 'Copy from Statistical Forecast' button added to Statistics View. |
| 28th January 2019 | 11.0 | Major release, featuring full integration with the open
source R statistics and data science system. Which
gives Prophecy users the following benefits:
In addition, there are a number of small optimisations, tweaks and the addition of a 'dark' theme to the 'Styles' menu, accommodating the 2019 'zeitgeist' for dark themes. |
| 11th May 2018 | 10.0.1.0 | Speedups, cumulative fixes and minor improvements release. |
| 26th September 2017 | 10.0.0.0 | Prophecy Version 10.0 represents the culmination of
nearly 18 months development and contains a number of much-requested
functional additions to the software. They are:
Please see the expanded version of this list, including screenshots, by following this link. |
| 6th April 2016 | 9.10.21.0 |
For customers with Prophecy years which are not Jan
to Dec there are some new database configuration settings
which will make years in Prophecy labelled "2016-17" or
"2016-2017". The 'Autosize to widest' option on the right-click menu in Prophecy reports now supports an additional shortcut key. If you hold Shift and click the option it also auto-sizes the row labels (as well as the numeric cells). If you hold Shift and Ctrl then the column widths will be sized to optimise the column label cells too. Nested label format rules now work on columns as well as rows in Prophecy reports. Cells with currency symbols would previously copy to the Windows clipboard with these symbols included. Now the currency symbol will be stripped, making Excel accept the cell as a number and not a text value. |
| 17th December 2015 | 9.10.19.0 |
This release supports multiple 'available from' / 'discontinued
from' dates per individual sku, a much-requested feature
from some customers. Secondly, if you try to log into Prophecy whilst your database manager is running a Prophecy maintenance script (which is not a good idea!) you will see the 'Supervisor Message' window, as previously. However, if you leave the 'Supervisor Message' window displayed then Prophecy will wait until the database management script has finished and then automatically continue whatever database activity you were running, providing that the structure and content of the database have not changed. If the structure or content of the database have changed then the only safe option allowed is to close Prophecy and re-login to the database. Therefore Prophecy will notify you that it needs to close and then close automatically. These changes improve the security of Prophecy Client and Database Manager interaction. Although it is inconvenient to have to log out of the database when you want to use it, database maintenance really needs exclusive access to your database and should be undertaken when everyone is out of Prophecy. The improved cooperation between the Prophecy Client application and database scripts in this update simply better protects the integrity of the database in cases where there are users logged into Prophecy during a database maintenance script. In addition, there are all the latest performance and stability improvements. |
| 27th October 2015 | 9.10.18.0 |
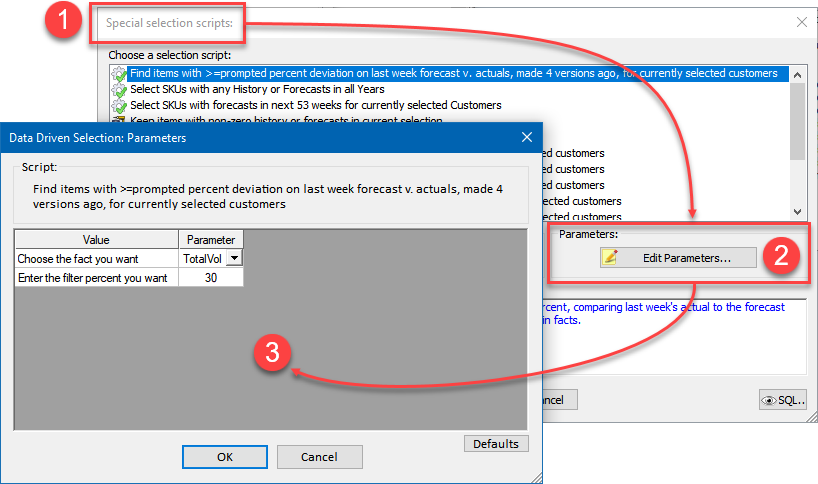
'Specials' on the Product and Customer Selector has
been renamed 'Data-driven' to better describe its function
and to reflect the new functionality that has been added
to this feature. Now you can set a data-driven drilldown script to ensure that, when you drill down, you only get to the child items that have sales or forecasts. In fact, the 'rule' can be fully customised for you by your database manager, using simple SQL. Please view a YouTube video which demonstrates the new feature in action by clicking this link. In addition, there are all the latest stability improvements. |
| 17th September 2015 | 9.10.17.2 |
Big new feature! With an appropriate data source
you can now graphically view the promotional program for
the item(s) you are forecasting alongside the forecasts
in a new Gantt-style view. For Prophecy databases hosted in SQL Server, Prophecy will now endeavour to reconnect to SQL Server in the event of a dropped connection. If you suffer a disconnection Prophecy will offer to retry connecting and then resestablish the connection if it can. Dropped connections occur due to wifi disconnects, computer going into hibernation or sleep or for other network disruptions. Please note that reconnection only occurs for the actual Prophecy database and not for any other connections that Prophecy may have initiated - e.g. to a tracking database or SQL Nugget source. However, it does mean you shouldn't lose forecast changes in the event of a disconnect. In addition, there are all the latest stability improvements. |
| 20th July 2015 | 9.10.16.4 |
This is largely a maintenance release to align the existing 32 bit Prophecy code base with the new 64 bit version, which was launched today. 64 bit Prophecy is 15%+ faster and can load much larger Prophecy reports. |
| 19th March 2015 ,20th March 2015, 31st March 2015, 8th
April 2015, 10th April 2015. |
9.10.15.0 9.10.15.1 9.10.15.2 9.10.15.4 9.10.15.5 |
This is an important maintenance release for Prophecy. The
Prophecy report files and database configuration files are
being changed to a more modern file format : zipped XML. This
is the same format used by Microsoft Office from Office
2007 onwards. If you are working over a slow VPN connection
to Prophecy you should see an improvement in Prophecy's
initial startup time. However, the main benefits from
this 're-plumbing' will come in the future because it opens
up the possibility for much more ambitious enhancements
to Prophecy. You should notice no differences to your Prophecy experience as a result of this underlying 'plumbing' change, other than at the beginning, where you may see a message from Prophecy telling you that a report library needs to be converted. This conversion will happen automatically and quickly - the message is for information only. Thereafter, your Prophecy will be loading the converted report library files rather than the original versions but the ongoing experience will be identical to before the conversion. This release also includes a couple of fixes and a possible performance enhancement for SQL Server Prophecy database users. (Note: V9.10.15.1, released 20th March 2015 is a minor (but required) maintenance update to V9.10.15.0.) (Note: V9.10.15.2, released 31st March 2015 is a second, minor maintenance update which resolves a Library rights issue.) (Note: V9.10.5.4, released 8th April 2015 is the second, minor maintenance update which resolves an issue with incorrect 'Very Long Labels' being displayed for products and customers.) (Note: V9.10.5.5, released 10th April 2015 contains a further fix to retrieval of very long product and customer labels and fully restores the previous behaviour to Prophecy.) |
| 9th February 2015 |
9.10.14.0 |
|
| 17th December 2104 | 9.10.12.2 | Fix to address very long scripted selection text in replaying reports. The space allowed for the script in the saved report file has been doubled. Long selection script text only occurs when the sort order for the item being selected (i.e. products or customers) is 'None' because the original order of items has to be saved in the script text. For any other sort option (e.g. as hierarchy or alphabetical) the original order is not necessary because the items can be ordered using the sort rule when the report replays. |
| 11th December 2014 | 9.10.12.1 | A couple of fixes to incorrect behaviour on the report Navigator (binoculars icon ) which were introduced in V9.10.12.0. |
| 24th November 2014 | 9.10.12.0 | Features, performance improvement and fixes:
|
| 28th October 2014 | 9.10.11.0 | When you Alt-Tab away from Prophecy and then back the Prophecy report cell you were previously on retains the 'focus' so you don't have to click on the window to restart using Prophecy. Added real-time messaging from the database manager to advise on things like future Prophecy maintenance, the addition of new items etc. Also added some minor stability features. |
| 11th Sept 2014 | 9.10.10.1 | This release adds 'Data-Driven' selections on products
and customers. 'Data-driven' selections means selecting
items based on any combination of data criteria sing background
SQL that Data Perceptions or your IT department can author
in minutes. For example:
|
| 6th June 2014 | 9.10.5.16 | Various fixes and minor improvements:
|
| 9th May 2014 | 9.10.5.15 | Added 'Paste' button to product and customer selector dialog boxes. Say you've copied a selection of product or customer codes from another application to the Windows clipboard and wish to see them in the selection in Prophecy. All you have to do now is click the new 'Paste' button and the items will be magically added to the currently selected items in the right hand list of the product or customer selector. The paste logic is able to ignore any codes or other text which cannot be found in the database - it simply parses the clipboard text into separate fields using a selection of delimiters (i.e. commas, semi-colons, tab characters etc.) and then tries to find each field in the hierarchy. If found, it adds it to the selection! Note: the logic always looks for codes that match, irrespective of the current label format selection in the dialog box or Prophecy report. |
| 7th April 2014 | 9.10.5.14 | 'Parallel Years' Quick Graph option now displays (optional)
moving average series lines. Moving average series lines
are now optional (i.e. can be switched off) on all relevant
Quick Graph types. Moving average series lines now drawn
with a dotted line for added clarity. Internationalisation fix on 'Export to Excel' feature for non-UK geographies. |
| 28th March 2014 | 9.10.5.13 | Copy/paste now behaves completely consistently for all
permutations where hidden rows or columns are concerned.
They are always skipped. (There was previously one paste
permutation where data in the clipboard would be pasted
into the hidden cells rather than the next visible cells.) The Product and Customer Label Builder option now works more effectively when using properties of the item's parents. There should be no duplication, for example when the label includes the item's parent and you are showing 'Total Products' or 'Total Customers'. |
| 23rd January 2014 | 9.10.5.2 | Added two new features to the product and customer selection
tools:
Fixed zero-day crash on Facts selector when changing label formats and then reordering facts. |
| 1st January 2014 | 9.10.5.1 | A more modern font is used if the Windows version supports it (i.e. Vista or later). Export to Excel feature speeded up as it was found to be noticeably slower when interoperating with newer versions of Excel. Various minor improvements and bugfixes. |
| 6th November 2013 | 9.10.4.3 | Previously, copying from cells which contain currency or other text characters would not paste correctly into other cells. This has now been fixed! |
| 22nd October 2013 | 9.10.4.2 | Added small buttons to Save/Update report dialogs which
let you see the list of products and customers which will
be saved in the report if you save/update the report as
a list-based (rather than script-based) report. A couple of fixes for non-customer-reported issues which Data Perceptions discovered during recent testing. System-compiled attributes (i.e. products bought by specified customer / customers buying specified product) now have improved labels, which include item codes. (N.b. a Prophecy Management Studio update is also required in order for the improved labels to feed through into the Prophecy Client application.) |
| 12th September 2013 | 9.10.3.2 | Prophecy data entry rules now display more appropriately
for all types of cells and Prophecy options. For example,
features like the Forecast Wizard, 'Paste All' option could
previously potentially trigger a rule violation box for every
cell in the target range. With this improvement a single
advice dialog will appear at the end of the process. You can now alter your Prophecy personal reports file - the file which populates the 'Personal' domain reports in the Prophecy Reports Manager dialog box. The filename can be set or changed by the following steps:
|
| 6th August 2013 | 9.10.2.3 | Minor updates, fixes and performance updates, including:
|
| 17th July 2013 | 9.10.2.1 | Maintenance release - contains several fixes and performance tweaks. |
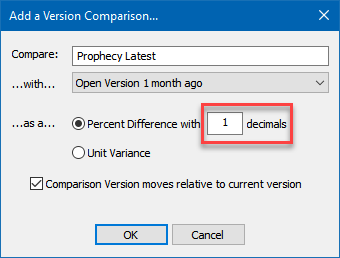
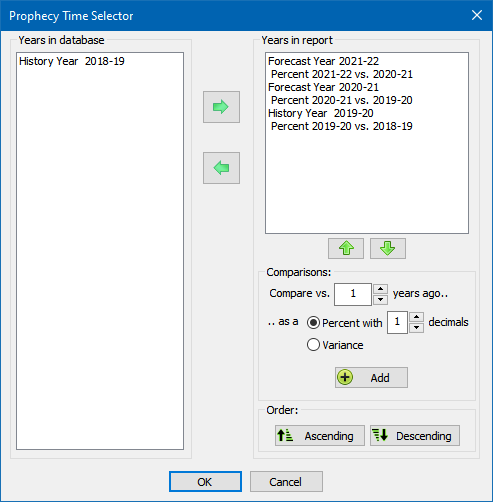
| 26th June 2013 | 9.10.1.1 | Several 'variables' have been added to the Conditional
Formatting, Label Contents functionality ('Format' tab in
Prophecy --> 'Label contents' button). They make it easier
to set up rules which match against Prophecy years or forecast
versions. The 'Label contents' rules feature allows you to introduce shading into your Prophecy reports, which persist on axis reorientations, drill downs and changed item selections. For example, say you want cells for year '2013' to be highlighted using a different background colour in order to make current year data more visible. You would create a label rule which matches the text '2013'. Any rows or columns with the text '2013' will then be painted with your specified background colour. But what happens next year - i.e. when current forecast year is 2014? Presumably you would want '2014' to be highlighted instead? Previously you would have had to edit the rule so that the text to be matched is changed from '2013' to '2014' and then updated the report in the Prophecy Reports Manager. However, now you can specify a 'variable' for the year. So, say 2013 is the currently selling year (i.e. forecast year 1) in Prophecy. Toalways match to the currently selling year, even when it is no longer 2013, you would click the 'Variables' button on the 'Add or edit a rule' dialog box and choose the highlighted option: 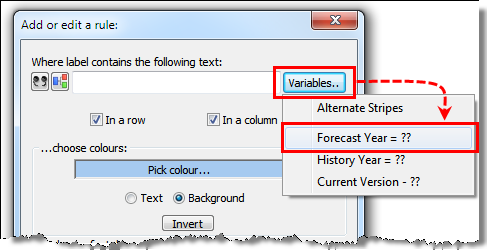
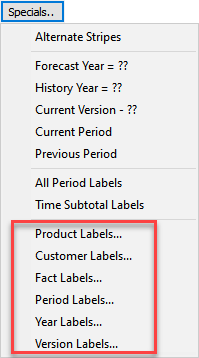
When you choose the highlighted option the special variable syntax will appear in the the label field as shown below. You can then replace the '??' with, in this case, '1' (because you want to always match against forecast year 1 in the Prophecy database): 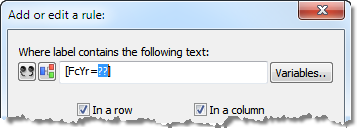
As you can see from the Variables menu in the previous screenshot, there are additional variables which allow you to match against history years and also forecast version labels. Press F1 for help when you are on the 'Add or edit a rule:' dialog box for more information on this powerful feature! |
| 5th June 2013 | 9.10.0.1 | New quick graph type plus enhancements to Takeaway database generation. |
 button
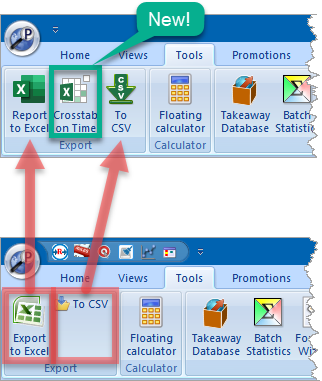
 -
-